
A Coverline is a horizontal line you draw on your chart that separates your preovulatory temperatures from your postovulatory temperatures. The Coverline provides a visual representation of your temperature shift and can provide insight into other aspects of your cycle health such as a potential luteal phase deficiency.
To draw your Coverline, you will first need to identify your temperature shift. A temperature shift is defined as a temperature that is at least .2° Fahrenheit or .11° Celsius higher than your temperature from the previous day, and at least .1° Fahrenheit/.05° Celsius higher than any of your temperatures from the previous six days.
Once you notice that your temperature is .2° F/.11° C higher than the previous six days, place your Coverline 0.1°F/.05°C above the highest of the six previous temperature readings.
To place a Coverline on your chart, simply press and hold your finger anywhere on the chart, and a horizontal purple line will appear. From there, you can drag the line to its proper place. If you make a mistake or want to erase your Coverline, just press and hold it, and drag it off the chart.
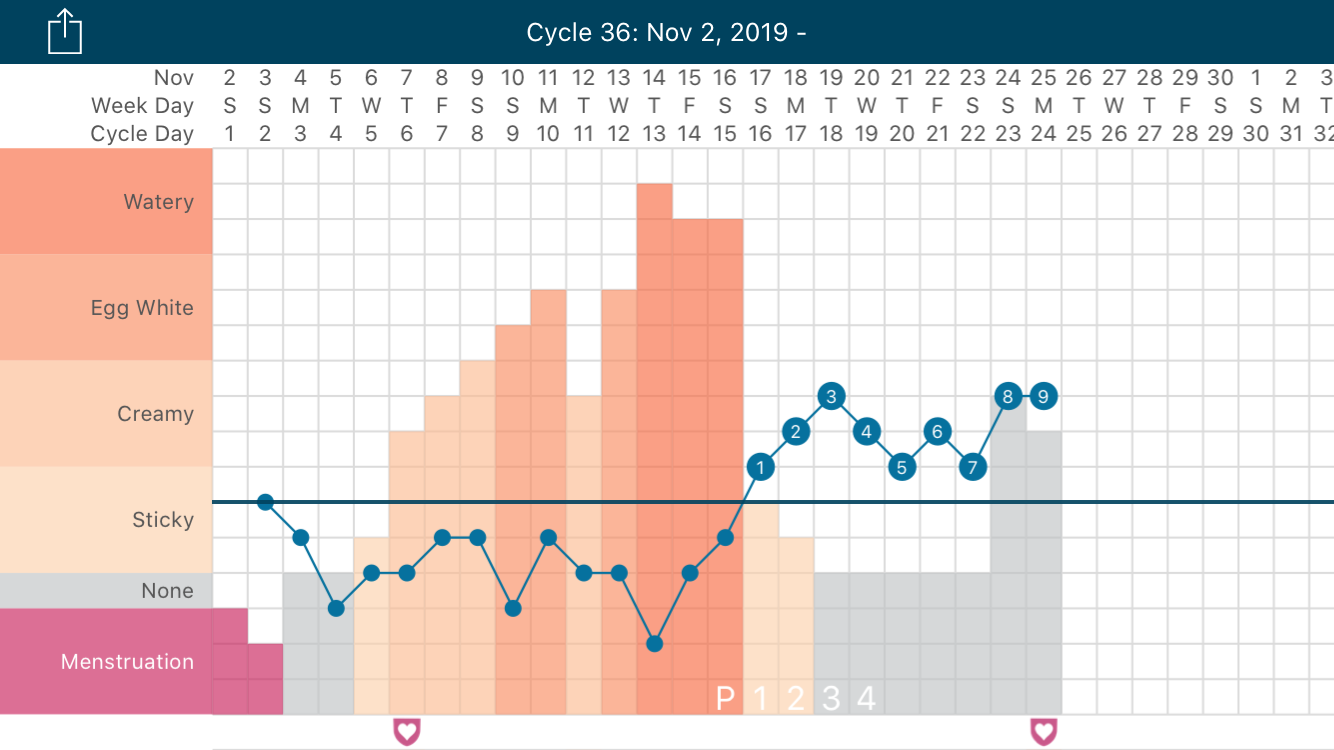
For any previous chart where a temperature shift was marked, the app will automatically place a Coverline in the proper place.
If you’ve placed a manual Coverline on a particular chart, it will override the automatic placement of the Coverline once your cycle has ended. If you’d like to go back to the automatic calculation, you can simply remove your manual Coverline and change the setting in the web portal. To do this, log in at app.kindara.com and go to your Charts, and edit the setting for Coverline from Manually Calculated back to Automatically Calculated.