
The Kindara web portal allows you to view your charts online with advanced analytics.
Here’s a rundown of what’s included in the web portal:
Account
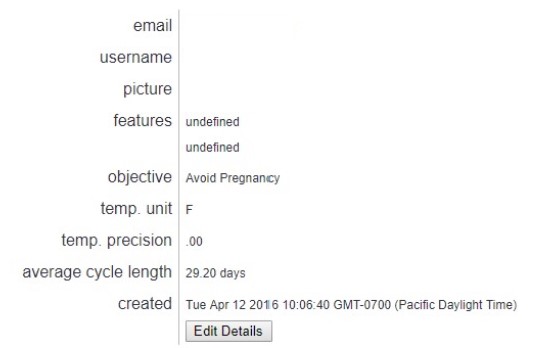
The Web Portal allows you to view your basic account details: your email address and name, objective (get pregnant/avoid pregnancy/other), temperature unit (F or C), temperature precision (.0 or .00), and the date your account was created. You can also edit your name, objective, temp unit, and temp precision on this screen by clicking the ‘Edit details’ button.
Days
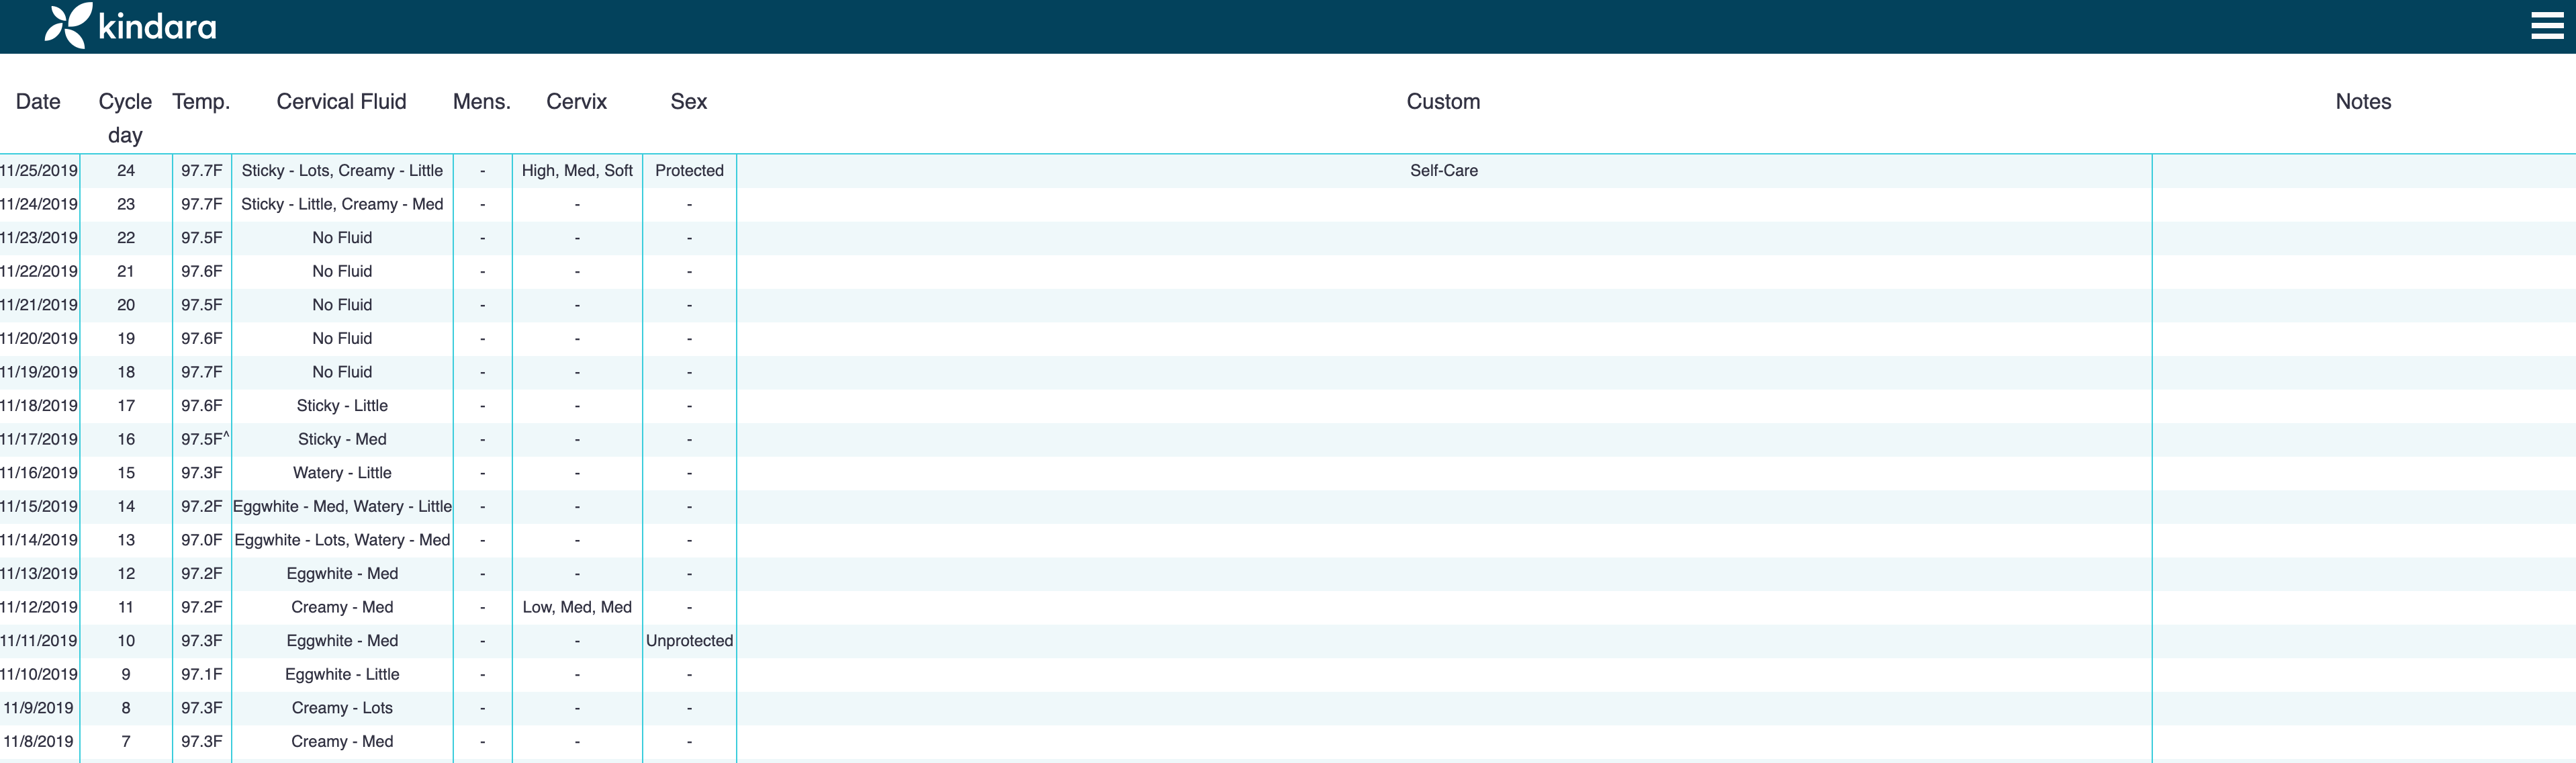
It allows you to view all of the data from each day of your cycle (date, cycle day, temperature, cervical mucus, menstruation, cervix, sex, custom data, notes) on one screen.
Cycles
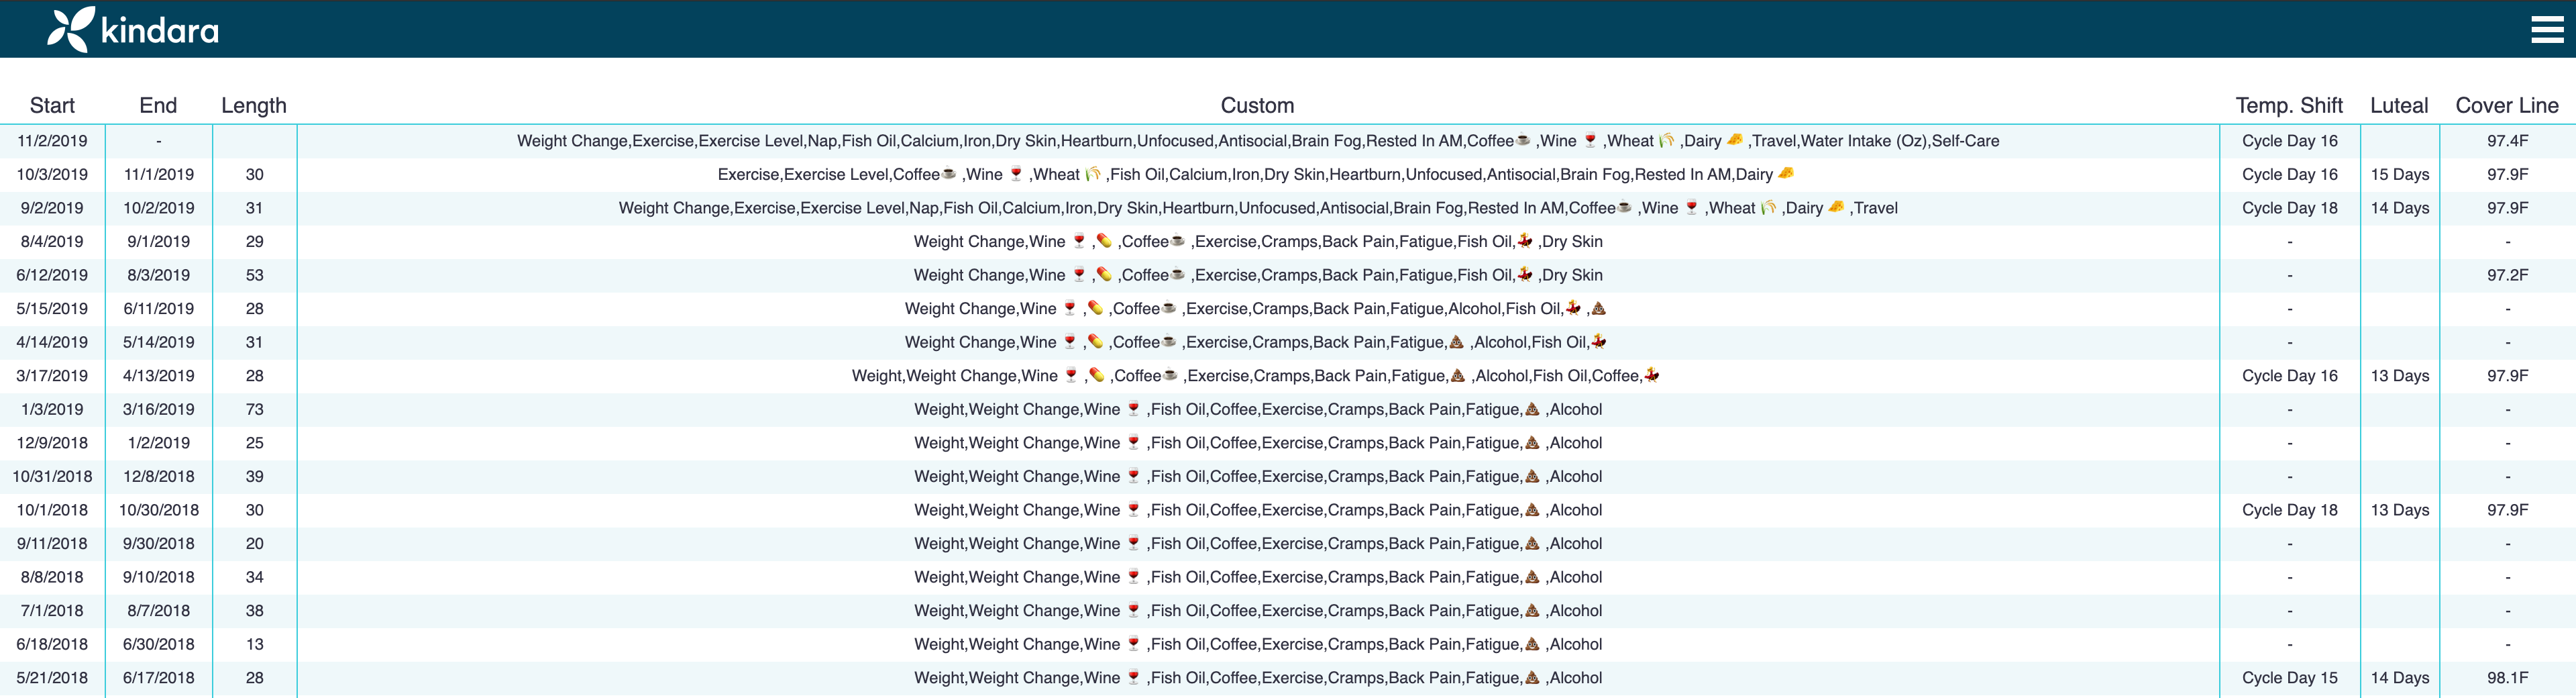
Allows you to view the data from each of your cycles (start date, end date, length, custom data, cycle day of temperature shift, and length of luteal phase) on one screen. You’ll notice there’s a column for ‘Cover Line’ – however, this feature is still in the works, so you won’t see any data there yet! But stay tuned :)
Charts
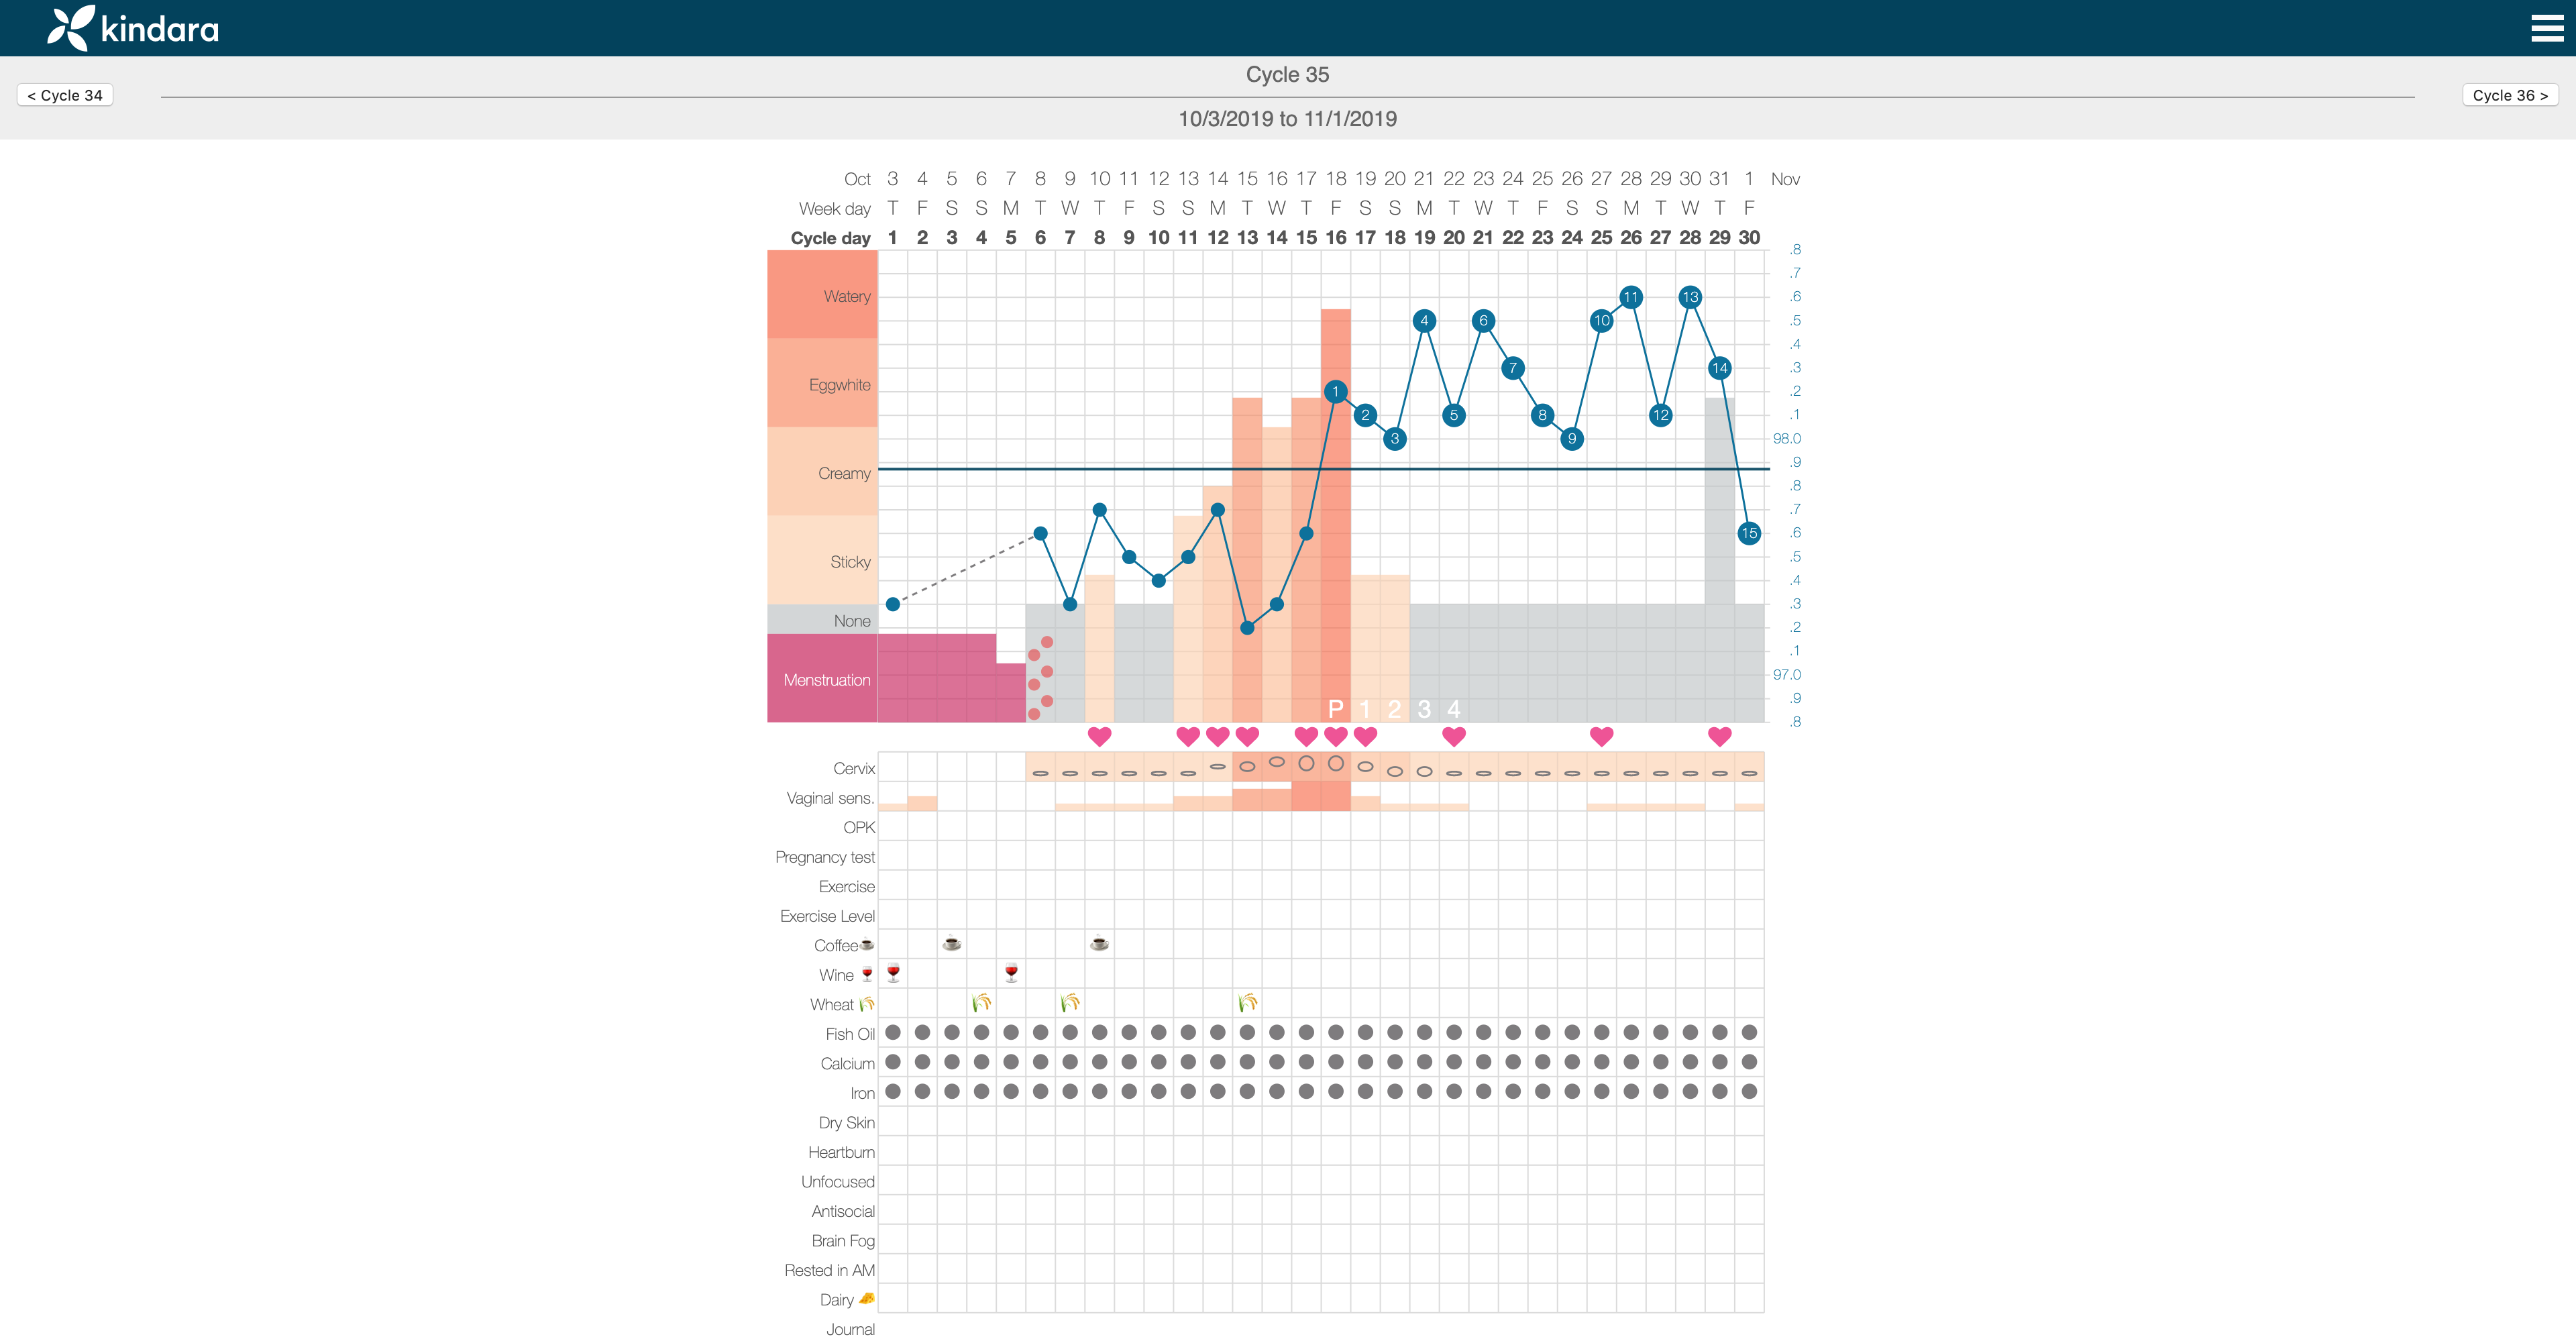
It allows you to view your charts, and flip back and forth between them, on your computer screen (easier on the eyes than viewing your charts on an iPhone!).
Sharing
It allows you to share your data with your practitioner. Simply enter your practitioner’s email address and click ‘Invite’, and an invitation will be sent to your practitioner to create a Kindara account. Practitioners can also invite clients to create a Kindara account and share their data with them through the practitioner portal.
